Guide to the Reports section
Tutorial on the reports section, understanding financial reports, and getting insights from your reports.
Written by Srishti
Updated over
6 months ago
Guide to the Reports section
Default view of the Reports section
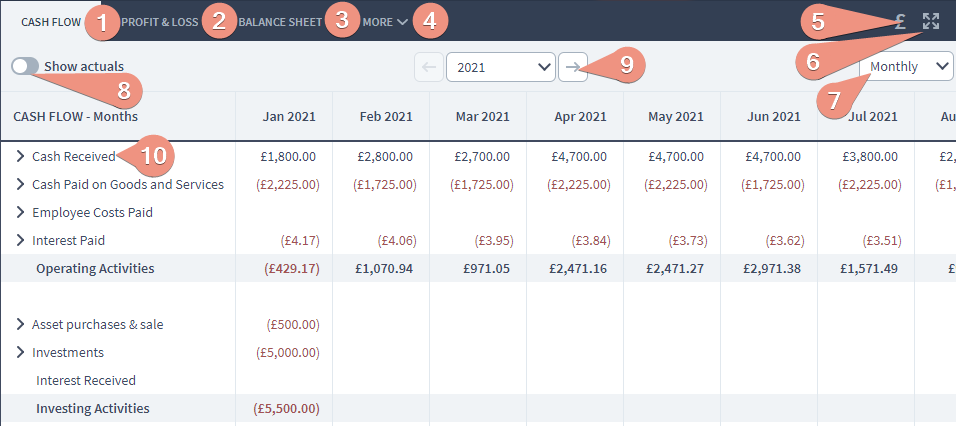
- Most used reports - The four most used reports, Budget, Cash Flow, P&L and Balance Sheet, are selectable here.
- More reports - Additional reports are available for selection under the “More” drop down.
- Settings menu - Selecting this allows you to:
- Toggle the currency symbol on or off in the reports
- Toggle whether rows with no figures are shown or not
- Input how many decimal places are used in the figures
- Select whether to scale figures to thousands, 10s of thousands, 100s of thousands or millions

Forecast/Actuals dropdown - allows you to switch between forecast reports, forecast vs actuals reports, or actuals to date reports.
-
Time Range- The time range dropdown can select which time range you want to forecast. Usually, these time ranges are grouped in a 1 year range, however there is also the possibility to make custom time range dates if you need more flexibility with your forecasting.
-
Report frequency dropdown - The Report frequency dropdown will process the information from the time range dropdown and display it in different frequencies on the dashboard. The frequencies are Monthly, Quarterly or Yearly.
- Full Screen expand button -Clicking on the expand button will expand the report dashboard to the entire size of your current screen.
- Reports drilldown - Clicking on the chevrons that are on the left side in any reports will drill down in that activity to display more detailed information.
As you can see, we drilled down from Cash Received > Sales(Plan Section) >Sessions(Group) > Components.
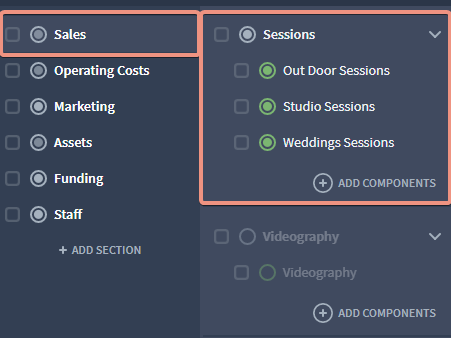
The Reports will always mirror the way you have built your plan. A good analogy would be to treat Sections as folders, and plan groups as sub-folders inside each "main" folder. At the end of chain are components, those being nested inside the sub-folders(groups).
Did this answer your question?


